To be completely honest, I selected EEMB 40 because it sounded like the most interesting course on the Winter 2009 Honors courses list. Soon, I found myself to really enjoy the material, possibly because it has a lot to do with public health, which I personally want to pursue in the future.
For those who might be interested, epidemiology is one of the five core disciplines offered at every CEPH (Council on Education for Public Health) accredited school. There are about 40 of these certified public health schools, including 4 in California (UC Berkeley, UCLA, San Diego States, & Loma Linda). The ASPH (Association of Schools of Public Health) lists possible career titles in the Epidemiology field: Director of Infectious/Chronic Diseases, Outcomes Researcher, CDC Investigator. Public health is very diverse and growing field; those pursuing a career in public health may work in a broad range of sectors.
www.asph.org
www.whatispublichealth.org
A few websites I found to be very helpful. For some reason, I haven't been able to post links on my posts.
Showing posts with label Epidemiology. Show all posts
Showing posts with label Epidemiology. Show all posts
Sunday, March 1, 2009

Friday, February 13, 2009
Level 4 Virtual Tour

So today in class Prof. Latto was talking about the different Biosafety levels of labs and how each lab differs. I was curious what it would be like to go into a level 4 lab, but because they have restricted access and so many safety precautions I didn't think I would ever see the inside of one...until I found this virtual tour of one online. It has pictures and details about each aspect of level 4 labs and the steps that workers have to take before they can even enter on e. I thought it was interesting that the entire building has to be airtight. It makes sense when you think about it, but I didn't realize the extent to which they take precautions against leaks. The windows cannot be opened, no air flows under doors, the air ducts are welded stainless steel, and the air coming out of the building goes through two filters that remove particles smaller than 0.3 microns. In case you were wondering how small that is, check out the picture on the right. The dust particle is one micron. (That's small!)
 e. I thought it was interesting that the entire building has to be airtight. It makes sense when you think about it, but I didn't realize the extent to which they take precautions against leaks. The windows cannot be opened, no air flows under doors, the air ducts are welded stainless steel, and the air coming out of the building goes through two filters that remove particles smaller than 0.3 microns. In case you were wondering how small that is, check out the picture on the right. The dust particle is one micron. (That's small!)
It's better to be safe than sorry!
Saturday, January 31, 2009
Mortal Terror in a Partial Zombie Population
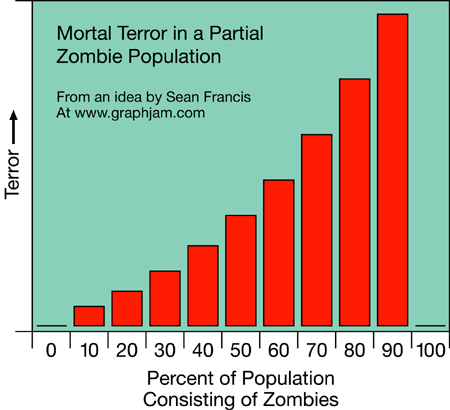 Okay, the graph is moderately amusing (and I am confident enough in my nerdiness that I can admit to finding most of the graphs on Graphjam moderately amusing) but the relevant point here is the discussion it sparked when posted on BoingBoing.
Yeah, this seems very inaccurate. If we're talking about "total amount of terror," it should go down the more people get zombified. If, as seems more likely, we're talking about the amount of terror in the average non-zombie, it still wouldn't be a smooth curve like that. It would plateau pretty damn early. The difference between 0% and 10% would be a lot bigger than the difference between 10% and 90%. And 100% wouldn't be zero terror, it would just be N/A: there is no more population.
This is directly relevant to SIR models because you can easily get confused if you fail to distinguish between individual and population level parameters. The confusion here is because 'terror' is not defined - is this your individual level of terror (a feature of the number of zombies and their fearsomeness), or the total amount of terror in the population (a feature of the number of zombies and their fearsomness AND the number of unzombified people around to be scared by those zombies).
Sunday, August 31, 2008
Accident, homicide, suicide
I think everyone should be aware of the leading causes of mortality for people in their age group. It helps to put risks in perspective and helps you see the reality behind various media scares. The CDC compiles this data so it is readily available. Take a look at the data from your age group (I'm presuming most of you are in the 15-24 age group). What is very conspicuous to me is that none of the leading causes of death are disease related - infectious or otherwise. Road traffic carnage dwarfs everything else, and homicide (and 'legal intervention') and suicide round out the top three. But notice that the overall death rate is low (90 per 100,000).
As you move into the next age group (25-44) notice that the overall mortality rate almost doubles (178 per 100,000) but that's still quite low. The carnage on the roads continues but AIDS, Cancer and heart diseases are moving up.
As we move into the 45-64 age group the death rate starts to rise sharply, up to 700 per 100,000. Mainly due to rising rates of heart disease and cancer. If you look at the final category of 65+ you'll see Pneumonia and Influenza crack the top 5.
I was thinking about this today because of the sad news that a 66 year old Santa Barbara woman, out running, was hit by a drunken driver early yesterday morning. I assume this will go down in the statistics as a motor vehicle 'accident'.
So please drive, walk and bike safe this labor day. And every other day for that matter. Even in our quiet paradise town by the sea there are drunks on the road at 7.30 in the morning.
This has been your labor day public service announcement.
As you move into the next age group (25-44) notice that the overall mortality rate almost doubles (178 per 100,000) but that's still quite low. The carnage on the roads continues but AIDS, Cancer and heart diseases are moving up.
As we move into the 45-64 age group the death rate starts to rise sharply, up to 700 per 100,000. Mainly due to rising rates of heart disease and cancer. If you look at the final category of 65+ you'll see Pneumonia and Influenza crack the top 5.
I was thinking about this today because of the sad news that a 66 year old Santa Barbara woman, out running, was hit by a drunken driver early yesterday morning. I assume this will go down in the statistics as a motor vehicle 'accident'.
So please drive, walk and bike safe this labor day. And every other day for that matter. Even in our quiet paradise town by the sea there are drunks on the road at 7.30 in the morning.
This has been your labor day public service announcement.
Thursday, August 28, 2008
Maps
 If you like your data in map form then here are a couple of sites you might want to explore over the holiday weekend.
First up is the Global Atlas of Infectious Disease, I did get quite a few broken links there but there's still some nice maps in the infectious disease section.
The Worldmapper website takes an interesting approach to mapping geographic data. It uses an algorithm that distorts the size of the country to represent the value of interest. The example shown below is HIV prevalence (proportion of people 15-49 with HIV). They have a number of such maps for diseases (eg TB, Cholera, Rabies, Influenza etc) and a whole range of other categories.

Saturday, February 9, 2008
Super spreading double dipping
 What is it with Seinfeld? I don't even particularly like the show but somehow I seem to have seen most of the episodes. It has replaced M.A.S.H. for the program that you are likely to watch when stranded in a motel or airport. The only reason I don't like it is that it is often too true to life, too painful to watch. I think the writing is wonderful and some of the best that has ever been on TV. The number of phrases that have made it into everyday language is amazing. Yadda yadda yadda... Anyway, this is all relevant to the class because of the classic 'double-dipping' episode. Science has now caught up with sit-com and the risks of double dipping have been quantified.
"I like to say it's like kissing everybody at the party — if you're double dipping, you're putting some of your bacteria in that dip."
Wednesday, February 6, 2008
The Lost Children of Rockdale County

In the spring of 1996, as Atlanta prepared to host the summer Olympic Games, an outbreak of syphilis struck a group of teenagers in the prosperous bedroom community of Conyers, Georgia. When epidemiologists interviewed the victims, they were shocked by what they heard: children as young as fourteen named scores of sexual partners, others told of all-night orgies and sex parties.
I'm pretty unshockable but I found this PBS show on an outbreak of syphilis in Georgia pretty amazing. Although the show was aired in 1999, thanks to good old PBS you can access a lot of information about it at a website dedicated to the show and even read a complete transcript.
The website will also give you access to details about the actual investigation of the outbreak, the techniques used and the results. For example this paper shows the complete network visualization of the outbreak I presented in class.
Tuesday, January 29, 2008
Solver for the SIR Model of the Spread of Disease

Here's a link if anyone is interested in more of the SIR model. It's the exact same model we talk about in class. You can plug in any number you want and see for yourself how fast a disease can spread. Here's the link
Monday, January 14, 2008
Epidemiology and virtual virus part 2
 'For days carpets of skeletons riddled the highest populated towns and were rendered uninhabitable by the persistent plague.'
Just following up on the post below. I found the following article in the Lancet (a leading medical journal) that answers many of my questions. This has a great many connections to this class.
'The untapped potential of virtual game worlds to shed light
on real world epidemics'.
Sunday, January 13, 2008
Epidemiology and Virtual Virus
This is an article that I found interesting that relates to our discussion on Epidemiology. Since last August, this was the first time that a virtual virus has infected a virtual human being in a manner resembling an actual epidemiological event. This has open up the field of Epidemiology with scientists now perhaps able to use certain virtual models to answer questions such as How many people will run away from a quarantine? Will they become more or less co-operative if they are scared? instead of being limited to punching in numbers in math models. Here's the link to the article is anyone is interested.
http://www.news.com.au/dailytelegraph/story/0,22049,22281585-5012895,00.html
http://www.news.com.au/dailytelegraph/story/0,22049,22281585-5012895,00.html
Friday, January 11, 2008
The Ghost Map
 If you'd like to read more about John Snow and the London cholera epidemic there is a nice book by Steven Johnson that came out in 2006 called 'The Ghost Map: The Story of London's Most Terrifying Epidemic--and How It Changed Science, Cities, and the Modern World.' As part of the publicity for the book they made an amusingly educational (or educationally amusing) animated video that is well worth 3 minutes of your time.
This graphical approach to depicting to disease has been adopted by a recent website Who is Sick?
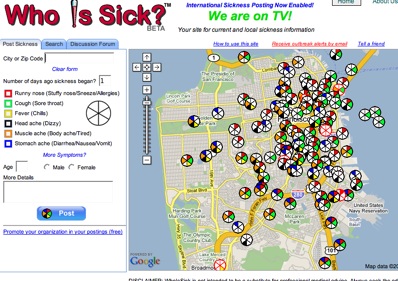 Here you can find out just what is going around in your community. I'm not sure they've really reached critical mass yet but if a lot of people reported their sickness on the website it would be a very useful tool. Currently you have to look at relatively large urban areas such as LA or the Bay Area to see its potential.
Tuesday, January 8, 2008
Infectious Disease Podcast
For news and reviews in the realm of infectious disease, check out "Persiflagers Infectious Disease Podcast" (or look in the Science Podcasts section of iTunes). It is provided by a doctor from Oregon (who spells out MRSA rather than calling it mersa), so some of it is a bit 'doctory.' But not surprisingly, a cast from mid-December highlighted several of the themes John touched on in Monday's lecture, and which we will be discussing throughout the quarter. Examples include antibiotic resistance, recent Ebola outbreaks and the virus' possible trend towards lower virulence (that's bad), TB, effects of climate change on Dengue, etc.
This might be a good source of relevant and tangential topics for the blog and for discussion. Plus, when you tell friends what you are listening to, they'll know just how nerdy you really are (or how nerdy your TA is).
This might be a good source of relevant and tangential topics for the blog and for discussion. Plus, when you tell friends what you are listening to, they'll know just how nerdy you really are (or how nerdy your TA is).
Subscribe to:
Posts (Atom)